ROK Winter Waterbird Censuses 1999-2024 / 1999-2024년도 겨울철 조류 동시 센서스


 1998 / 99
 1999 / 00
 2000 / 01
 2001 / 02
 2002 / 03
 2003 / 04
 2004 / 05
 2005 / 06
 2006 / 07
 2007 / 08
 2008 / 09
 2009 / 10
 2010 / 11
 2011 / 12
 2012 / 13
 2013 / 14
 2014 / 15
 2015 / 16
 2016 / 17
 2017 / 18
 2018 / 19
 2019 / 20
 2020 / 21
 2021 / 22
 2022 / 23
 2023 / 24
| Winter | Nov | Dec | Jan | Feb |
| 1998 / 99 | 7 | |||
| 1999 / 00 | 13-14 | |||
| 2000 / 01 | 30 | |||
| 2001 / 02 | 27 | |||
| 2002 / 03 | 26 | |||
| 2003 / 04 | 1 | |||
| 2004 / 05 | 15 | |||
| 2005 / 06 | 21 | |||
| 2006 / 07 | 20 | |||
| 2007 / 08 | 25-27 | |||
| 2008 / 09 | 16-18 | |||
| 2009 / 10 | 22-24 | |||
| 2010 / 11 | 21-23 | |||
| 2011 / 12 | 27-29 | |||
| 2012 / 13 | 25-27 | |||
| 2013 / 14 | 24-26 | |||
| 2014 / 15 | 12-14 | 16-18 | ||
| 2015 / 16 | 11-13 | 15-17 | ||
| 2016 / 17 | 9-11 | 13-15 | ||
| 2017 / 18 | 9-11 | 13-15 | 13-15 | |
| 2018 / 19 | 14-16 | 18-20 | ||
| 2019 / 20 | 13-15 | 17-19 | ||
| 2020 / 21 | 11-13 | 15-17 | ||
| 2021 / 22 | 13-14 | 11-12 | 15-16 | 18-19 |
| 2022 / 23 | 11-13 | 9-11 | 13-15 | 17-19 |
| 2023 / 24 | 8-10 | 12-14 |

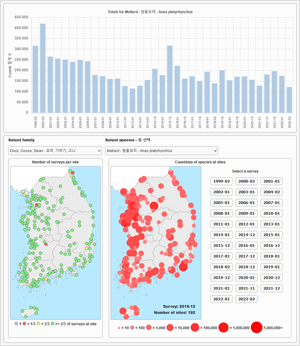
A compilation of the censuses' published data into totals for each species recorded per survey, winter and mid-winter and additional information about species and Ramsar criterions.
Important Information
- Notes on Views on Data
- Notes on Sites
- Notes on Species
- Notes on Data
1. Notes on Views on Data
- This page provides four views on the MoE Winterbird Census data.
- Totals per Species and Survey: This shows the totals for a species for all surveys. Is a species selected, a map is shown with all sites where this species was recorded. The color of the dots indicate in how many surveys the species was selected. In a second map the user can select every survey the species was recorded and the map is updated and shows with different sized and colored dots the distribution.
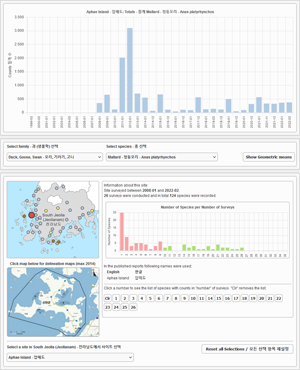
- Totals per Species and Winter - with statistical information: This shows the max counts for a species for a winter. In addition some statistical information like 'Best fit values and line', '95% Confidence Interval and lines' and 'Goodness of Fit (R-square)' can be displayed.
- Totals per Species and Mid-Winter - with statistical information: This view shows the survey data for a "mid-winter" period defined as the four weeks between January 7th and February 2nd.
- Totals per Survey Site and Survey: This view is based on the survey locations and shows all data based at the location level. In addition there is a list for the Ramsar Critrion 5 (20,000 waterbird threshold) and two lists for the for the Ramsar Critrion 6 (1%-criteria), one based on species and one on location.
2. Notes on Sites
- The surveys started with 69 sites in 1999 constantly increasing to over 190 in 2011 and covers 200 sites since 2014. Therefore interpreting the data for the time before 2014 needs to be done with some caution.
- The first year 1999 is added for completeness even though the number of sites was only 69 of which many were split up in 2000.
- In total at 231 site surveys were conducted. Over the years sites have been added and excluded from the surveys and recently 200 sites are reported.
- From winter 2017 on the two survey sites of Yeongjong Island are reported as one site and therefore the data from earlier surveys is also shown only as a combined dataset on this page.
- Over the years names of several sites have changed. In Korean sometimes a "," or "-" had been used to separate name parts, sometimes details have been added or removed. English names had changes in spelling or for example changed from "Lake" to "Reservoir". A list with all different names used is shown in the site information section.
3. Notes on Species
- The names of species and their grouping into families is based on the Bird Korea checklist 2022. There are four species that are not listed in the Birds Korea checklist and therefore old names are used for these.
- The scientific names of species in the reports do not always reflect the actual taxonomy and names based on the IOC World Bird Checklist which the Birds Korea Checklist does. Therefore the reference are the Korean names in the reports.
- In the winter 2000 is one record at site 46 of Xema sabini (Sabine's Gull - 목테갈매기) with a count of 3. In the winter 2006 is one record at site 104 of Larus minutus (Little Gull 꼬마갈메기) with a count of 1. In the winter 2008 is one record of Anas rubripes (American Black Duck 미국오리) at site 29 with no count number and one record at site 35 with a count of 23. Also in 2008 for site 2 is one record of Dendrocopos minor (Lesser Spotted Woodpecker 쇠오색딱따구리) with a count of 1. All four species are not in the actual Birds Korea checklist as there are no confirmed records for these species, therefore the names from the reports are used.
- Up to the winter 2018/19 records for Great Egret were seperatly recorded for Ardea alba alba (대백로) and Ardea alba modesta (중대백로). From winter 2019/20 there are only records for Ardea alba (중대백로), therefore all data for Ardea alba is accumulated into Great Egret Ardea alba (중대백로).
- In the reports are records for Cettia diphone with the Korean names "휘파람새" and "섬휘파람새". These were formerly the two subspecies Cettia diphone borealis and Cettia diphone cantans. Recently they were seperated into the two distinct species Horornis diphone (Japanese Bush Warbler 섬휘파람새) and Horornis canturians (Manchurian Bush Warbler 휘파람새) with subspecies borealis (Korean Bush Warbler 휘파람새). As there are less than five confirmed winter records for Horornis canturians in the ROK, all records are considered as Horornis diphone (Japanese Bush Warbler 섬휘파람새).
4. Notes on Data
- The data shown for the year 1999 are from the "1999-2004 Report" because data was split for several locations into the locations surveyed since 2000. Because of the much lower number of locations surveyed in the earlier years, comparison of totals with later years needs to be done with caution.
- The reports have tables for every site surveyed with the count data and a total number for the site. In the separate chapter IV a table shows the overall totals for all previous survey dates and the ones covered by the report.
This chart shows the data calculated with the data of the tables because the total numbers in the reports don't add up all the time as sometimes the total number for a data table does not match the data in the table, sometimes the overall total does not match the sum of the table-totals and/or the table data.
Most obvious examples of manual change of numbers are the grand totals for the year 1999 and 2011: the 1999 total changed in 2015 from 954,483 to 1,068,309 (+11,9%) and the one from 2011 changed in 2012 from 1,259,717 to 1,267,651 (+0,6%).
The table below lists all found differences.Winter Census
dateGrand total
Chaper IV (GT)Total of site
totals (ST)Diff
(GT)-(ST)Calculated
total (CT)Diff
(ST)-(CT)Remarks on (ST)-(CT) differences W-89-99 1999-02 1,068,256
2004-2014:
954,483
2015-2023:
1,068,309954,483 0 954,349 +134 loc 1: +1, loc 53: +132, loc 88: +1, loc numbers:1999-2004 report W-99-00 2000-02 1,184,694
2004-2023:
1,157,044
2015-2023:
1,182,4051,156,939 +105 1,158,421 -1,377 loc 88: -6, loc 118: +36 loc numbers:1999-2004 report
The 1999-2004 report omitted two sites that were only counted in 2000 Hwangam Reservoir total 1,406 and Goheung Podumyeon total 105 (report 2000)W-00-01 2001-01 964,150
2004-2023:
963,845965,192 -1347 965,182 +10 loc 88: -3, loc 116: -1, loc 118: +14 loc numbers:1999-2004 report W-01-02 2002-01 932,258 932,258 0 932,264 -6 loc 30: -14, loc 88: -1, loc 116: +1, loc 118: +8, loc numbers:1999-2004 report W-02-03 2003-01 975,516 975,516 0 975,510 +6 loc 30: +12, loc 88: -6 loc numbers:1999-2004 report W-03-04 2004-02 1,112,746 1,112,746 0 1,112,762 -16 loc 30: +2, loc 53: -18 loc numbers:1999-2004 report W-04-05 2005-01 1,186,295 1,178,916 +7379 1,178,925 -9 loc 9: -1, loc 92: +10, loc 118: -18 W-05-06 2006-01 1,227,227
2015-2023:
1,227,2781,233,826 -6599 1,226,966 +261 loc 9: +2, loc 11: -1, loc 16: +10, loc 21: -97, loc 26: +131, loc 31: +1,
loc 37: +7, loc 50: +34, loc 53: +260, loc 71: +4, loc 78: -30,
loc 82: +1, loc 89: +6572, loc 91: +1, loc 94: -1, loc 96: +2, loc 125: -36
The report has a summary table for the sites on page 379 and there the number for loc 89 is correct explaining most of the (GT)-(ST) difference but others differ from the numbers in the loc tables.W-06-07 2007-01 1,596,697 1,596,697 0 1,596,592 +105 loc 21: +14, loc 104: +91 W-07-08 2008-01 1,483,891 1,510,739 +25,974 1,484,765 -874 loc 5: -907, loc 6: +148, loc 11: -54, loc 12: +56, loc 13: +20,185,
loc 19: -12, loc 58: -12, loc 59: +18, loc 70: -12, loc 74: +6,538,
loc 109: +70, loc 133: -45, loc 139: +1
The report has a summary table for the sites on page 439 and there the number for sites 13 and 74 are correct explaining most of the (GT)-(ST) difference.W-08-09 2009-01 1,944,065 1,944,065 0 1,944,065 0 W-09-10 2010-01 1,452,215 1,452,215 0 1,452,023 +192 loc 45: +196, loc 134: -4 W-10-11 2011-01 1,259,717
2012-2014:
1,267,651
2015:
1,259,716
2016-2023:
1,259,7171,259,717 0 1,259,826 -109 loc 44: -110, loc 107: -1, loc 160: +2 W-11-12 2012-01 1,087,560
2013-2023:
1,087,5061,087,506 +54 1,086,308 +1198 loc 35: +1228, loc 132: -30 W-12-13 2013-01 1,133,394 1,113,381 +13 1,159,986 -26,605 loc 11: -577, loc 14: -539, loc 18: -1,627, loc 29: -13, loc 35: -16,853,
loc 36: -11, loc 44: -17, loc 54: -165, loc 68: +2,479, loc 75: -9,055,
loc 121: -337, loc 130: +5, loc 156: +105W-13-14 2014-01 1,276,293 1,276,293 0 1,275,096 +1197 loc 2: +3, loc 10: +3, loc 11: +4, loc 18: +2, loc 19: +90, loc 27: +1,
loc 30: +1, loc 35: +2, loc 36: +1, loc 37: +2, loc 38: +1000, loc 39: +3,
loc 41: +1, loc 42: +3, loc 44: +1, loc 47: +18, loc 48: +1, loc 52: +5,
loc 55: +3, loc 75: +1, loc 81: +1, loc 82: +2, loc 83: +5, loc 85: +1,
loc 86: +1, loc 105: +2, loc 106: +2, loc 107: +1, loc 118: +1,
loc 133: +1, loc 135: +1, loc 136: +1, loc 137: +3, loc 138: +1, loc 147: +1,
loc 150: +15, loc 156: +10, loc 176: +2, loc 181: +1W-14-15 2014-12 1,133,239 1,133,239 0 1,133,239 0 2015-01 1,266,638 1,266,638 0 1,266,638 0 W-15-16 2015-12 1,790,987 1,790,987 0 1,790,982 +5 loc 104: +4, loc 126: +1 2016-01 1,584,438 1,584,438 0 1,584,438 0 W-16-17 2016-12 1,198,348 1,198,348 0 1,198,348 0 2017-01 1,332,180 1,332,180 0 1,332,180 0 W-17-18 2017-12 1,084,895 1,082,833 +2062 1,082,805 +28 loc 154: +28 2018-01 1,446,394 1,438,499 +7895 1,438,531 -32 loc 8: -20, loc 200: -12 2018-02 1,002,271 999,264 +3007 999,272 -8 loc 4: +1, loc 110: +9, loc 161: +2, loc 162: -2 W-18-19 2018-12 1,320,063 1,320,063 0 1,320,091 -28 loc 5: +5, loc 36: +4, loc 50: +9, loc 112: -73, loc 162: +83 2019-01 1,469,859 1,469,859 0 1,469,849 +10 loc 29: +2, loc 36: +18, loc 117: -1, loc 162: +13, loc 182: -42 W-19-20 2019-12 1,817,156 1,817,156 0 1,817,156 0 2020-01 1,629,106 1,629,106 0 1,629,106 0 W-20-21 2020-12 1,571,494 1,556,748 +14,746 1,557,136 +14,358 loc 29: -383, loc 113: -5
while these two numbers explain the difference between +14,746 and +14,358, but from the data the +14,358 could not be determined.2021-01 1,445,316 1,445,316 0 1,445,528 -212 loc 29: -212 W-21-22 2021-11 1,387,131 1,387,131 0 1,387,131 (+1) In first publication loc 86 data table has no number 1 line, confirmed as error, species and count number received 2021-12 1,732,841 1,732,841 0 1,722,132 (+10,709) In first publication table IV-2 has the higher number in the total line, but the sum of the sites and the sum of all individual count numbers result to the smaller number, confirmed as error 2022-01 1,746,189 1,746,189 0 1,746,189 (+1) In first publication loc 86 data table has no number 1 line, confirmed as error, species and count number received 2022-02 1,353,735 1,353,735 0 1,353,735 (+1) In first publication loc 86 data table has no number 1 line, confirmed as error, species and count number received W-22-23 2022-11 1,613,709 1,613,709 0 1,613,707 +2 loc 48: +2 2022-12 1,814,099 1,814,099 0 1,814,099 0 2023-01 1,746,189 1,689,317 0 1,689,317 0 2023-02 1,528,667 1,528,667 0 1,528,667 0 W-23-24 2023-12 1,599,044 1,600,292 -1,248 1,600,292 0 Incorrect tranfer of totals from location table 17 and 71 into table IV-5 2023-12 1,501,998 1,504,521 -2,523 1,504,521 0 Incorrect tranfer of totals from location table 17 and 71 into table IV-5